
Gerry McCartney and Phil Hanlon
July 2008

© Wlai and licensed under the Creative Commons Attribution-Non-Commercial-Share Alike 2.0 Generic Licence
Introduction
The dilemma of the sigmoid curves is a concept developed by Handy to describe how companies develop over time. [1] The dilemma relates to the fact that most companies will grow in a sigmoid pattern (i.e. initially slowly as the pre-requisites for take-off are acquired, then more quickly as the organisation matures, then slowly again as diminishing returns occur, before ultimately diminishing in size) unless they purposefully reinvent themselves whilst resources are still plentiful to do so (Figure 1). It is a telling fact that the vast majority of companies do not survive for more than one hundred years, and those that do have reinvented their purpose.
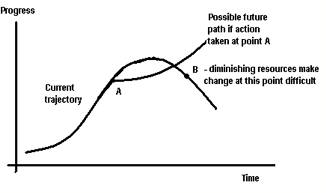
Figure 1. The dilemma of the sigmoid curves (adapted from Handy [1])
When Handy uses this diagram he is usually working with a business. He asks them where they are on the first curve. Are they still growing (point A), have they reached their peak (midway between A and B) or are they in decline (point B)? He argues that the best place to start the new growth curve is point A where the resources of continuing growth from the first curve can be used to enable the launch of the new curve — but that takes leadership and the courage to launch out on a new venture while things seem to be going fine. Point B is the most common point of departure but by this time resources are diminishing and people have lost confidence in their leaders. This sigmoid pattern of development and growth is seen in various natural and anthropogenic systems including physiological development and the proliferation of species.
In this article it is argued that the dilemma of the sigmoid curves is a useful model to describe the dilemma facing society today such that a radical change of course is required if a deterioration in the quality of civilization and society is not to deteriorate.
Progress since the Enlightenment
Progress in society had been slow and intermittent for centuries prior to the Enlightenment. However the analysis and changes introduced around this time created definite examples of progress, and at an increasing rate, mirroring the initial part of Handy’s curve. It was from this period that there was surplus output from the land to support industrialisation and resources to support education for more and more of the population. Technology advanced rapidly and the capitalist system developed as part of this process. Thus a self-perpetuating series of events was triggered that continues to this day based on ever-increasing accumulation of goods and services; a process that cannot be halted without fear of economic and social collapse.
Today society remains bound by this ever increasing reverberation of economic growth originating more than 300 years ago. For much of the first 250 years of this revolution the fruits were numerous: freedom from never-ending toil on the land and serfdom; increasing gender equality; universal suffrage; increased leisure time; reduced faith in the infallibility of ‘chosen’ individuals, institutions and unchallengeable gods; a rise in meritocracy and a decline in patronage. Even the unimaginable inequalities between the upper and working classes were narrowed with safety nets provided for all in society. Thus capitalism was a marked improvement on the previously dominant systems of societal organisation (such as feudalism). That is not to say that capitalism itself was the best possible system for that time, it has been rightly criticised as being a system only less perfect than that which preceded it. It is therefore consistent with Handy’s model to suggest that capitalism and the Enlightenment represent this initial burst of progress.
Diminishing returns for the Enlightenment project
This article focuses on the cracks that have appeared in the system in the last 30 years. Measures of population well-being and happiness have been in slow, steady decline across developed nations. The earlier reductions in inequalities in wealth, power and health have now been wiped out and continue to increase along with a cultural shift towards the glorification of the super-rich. The benefits of higher productivity have not delivered the expected time for reflection and enjoyment, instead being replaced by a thirst for ever increasing consumption and a perceived need for speed, activity and quantity. In health terms the diseases of overconsumption (obesity and substance misuse) and depression are rising rapidly. These suggest that diminishing returns are now being seen in the rate of societal progress.
These problems do not in themselves challenge the continued progress of society, as capitalism and its order-generating rules (the sanctity of property and the pursuit of profit in the marketplace) have proven resilient and responsive to new challenges. However there are now three phenomena that question its continued dominance in the manner of the Handy’s sigmoid curves. These are climate change, peak oil and economic depression: a perfect storm of problems. [2] It is argued here that these are the factors that may point towards a decrease in the progress curve of society.
A perfect storm brewing: climate change
Climate change is the first challenge to capitalism. There are two opposing views of how the positive feedback loops, corresponding to an increase in global mean temperatures of approximately two degrees Centigrade, [3] can be avoided.
The first is that the economy can be ‘greened’ through technological advance. This would entail some resources being invested into replacement technologies for the internal combustion engine, coal and gas-powered electricity generation and various manufacturing processes. It is envisaged that this process can be provoked through appropriate subsidies, tax incentives and the creation of markets for carbon. [4, 5]
The alternative view is that capitalism by its very nature cannot achieve the necessary reductions in greenhouse gases because an economy in this system will always require long-run economic growth. Although carbon-free economic growth is possible (for instance growth in knowledge or in the consumption of art), the vast majority of economic growth is underpinned by a continuous increase in the total amount of goods consumed which have a ‘carbon cost’. If economic growth does not continue in the long-run borrowing to invest and the repayment of loans becomes impossible and the basis of the economic system is undermined. Furthermore, the pursuit of profit creates a ‘race to the bottom’ for environmental protection. If any single company decides to use a technology that is less emitting, or produce a product closer to home at the expense of higher labour costs, the market will punish them by moving the profits to those firms who are willing to exploit the environment. There is no indication that the level of market regulation that is required to achieve a ‘level playing field’ is being considered. This is particularly difficult where there is a globalisation of trade without a globalisation of employment and environmental regulations. Indeed, if such regulation was to be enforced now that manufacturing has largely been internationalised to South-East Asia and China, it would have a devastating effect on the economies of these countries and the international economy generally. The consequences of not taking sufficient and urgent action to reduce greenhouse gas emission to avoid breaching the two degrees centigrade threshold are potentially catastrophic. [6]
A perfect storm brewing: peak oil
The second component of this perfect storm is increasing oil scarcity as part of a phenomenon known as ‘peak oil’, where the rate of oil production goes into decline following the extraction of approximately half of the discovered reserves (Figure 2). [7] As with all finite resources, oil is expected to become increasingly expensive as more is extracted. The second half of any oil field is always more expensive to extract and the flow of oil can be shown to decrease. The rate of discovery of new oil resources has declined since the late 1960s and it is now implausible that this rate will increase to a level that would significantly increase oil reserves such that scarcity could be avoided. To make matters worse, the world’s demand for oil continues to increase. This increase in scarcity would not be such a problem if substitute energy sources were readily available, but there are no current examples, nor any promising developments, that suggest that this is the case.
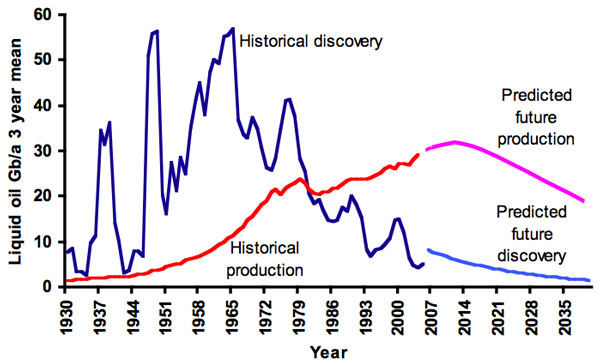
Figure 2. The three year mean global oil discovery and production curves and future predictions (adapted from Campbell [7])
It has been suggested that biofuels may be a possible substitute energy source, but the required land mass to achieve this is prohibitive. This can be illustrated by considering how fossil fuels such as oil were laid down in the earth’s crust and comparing that with how biofuels are produced. Fossil fuels are actually thousands of years of solar energy of an area captured as plants and organisms and concentrated by the process of fossilisation. In contrast, biofuels represent the captured solar energy of a land area over a single year. Although this is a renewable resource, in that the plants (such as sugar cane) can be grown on the same land year after year, the relative concentration of energy between biofuels and fossil fuels is so low that there is not sufficient land area to produce both biofuels and food for the global population. [8-10]
Some argue that the market mechanism will be sufficient to deal with future oil scarcity. However, this underestimates the importance of oil in the economy generally, since previous oil price spikes in 1973 and 1979 caused severe recessions. There is a highly inelastic demand response to oil price increases (i.e. demand for oil is not tempered by rises in oil price). [11] Furthermore, globalisation and the consequent movement of manufacturing to poorer countries have made international transport (the most highly inelastic sector of the economy) more important for the economy. It is untrue that higher oil prices will simply generate increased production. Oil price rises will simply make it economic to continue production of the poorest quality and most difficult to access reserves, but will not be able to stimulate increased production for the simply reason that the resources will be depleted. This has been demonstrated empirically for many oil fields which have been unable to increase production in response to higher prices. [12] In short, rising prices do not prevent depletion.
Rapidly rising oil prices will destroy vast sectors of the economy such as aviation and tourism as well as making trade for manufactured goods increasingly expensive. There simply is no alternative fuel source to fly planes; not even at prototype stage. A trade-off will therefore be made between oil for fertiliser, oil for cars and trucks, oil for planes and shipping or oil for manufacturing. It is not possible to do all of these activities to the same degree once depletion sets in. A market-led adaption would involve a liquidation of swathes of the economy with the consequent crippling effect on employment, output and inflation that this would have. As it becomes uneconomical to import manufactured goods to Western countries, the demand for financial services will decline, compounding the problem. Once significant portions of the economy are found to be unsustainable it is difficult to conceive how banks, particularly given their current self-imposed destruction, would survive and how the economy as we know it could continue.
The trends in the price and production rate of oil are shown in Figure 3. It is worth noting that the price (in 2008 priced $) has been above $90 per barrel since the start of this year, and is currently at over $130 per barrel. This can only be explained by dollar weakness or supply shortfall. The imminence of global recession should provide downward pressure on prices, not an upward pressure. Although tempered by a number of caveats, a recent oil production report by BP demonstrated that consumption has outstripped production of crude oil for the last three years and that total world oil production in 2007 was less than in 2006, strongly suggesting that ‘peak oil’ is imminent or has passed. [13]
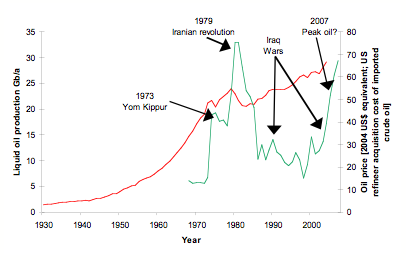
Figure 3. Oil production and price level trends since 1969 with significant events (personal communication from James Williams, oil economist)
A perfect storm brewing: financial crash
The last challenge to the capitalist status-quo is the financial crisis now unravelling. [14]
The UK prime minister Gordon Brown has famously been credited with generating ‘the longest period of sustained economic growth for over 100 years’ whilst Chancellor of the Exchequer. What is not so well known is that this has almost entirely been achieved by borrowing on the never-never. The government has consistently paid for new schools and hospitals in the last 10 years using the discredited private finance initiative (PFI). This has meant that it has entered into contracts on our behalf to pay two or three times the actual cost of the buildings over 30 years using commercial borrowing rates with the banks. This means a shiny (if poor quality) set of buildings in time for the elections without having to pay a penny; until now.
But it is not just the UK government that has been spending money they don't have. Both here and in the USA governments have been pushing people into buying houses they can't afford by failing to build sufficient social housing, restricting housing supply and loosening the rules on the provision of credit and mortgages. This has meant that the average level of mortgage debt has risen to the same levels relative to earnings that we saw just before the housing crash in the early 1990s.
All of this alone would be bad enough, but entire banking sector is in crisis. $121bn has been wiped off the value of banks in the last year — the most famous being the collapses of the banks Northern Rock and Bear Stearns. The US and UK governments have been forced to write off these debts with public money to prevent the assets of these banks (i.e. people's homes) being liquidated (i.e. auctioned off to the highest bidder) as those banks have lost the money borrowed on the value of those houses on the international financial gambling circuit. Many of the other banks are looking at their balance sheets and realising they are in real trouble. HBOS has gone from a value of $82.8bn to $42bn and RBS from $140bn to $74bn in the last year. These particular losses haven’t yet bottomed out.
House prices are now beginning to fall as there is a growing realisation that credit (mortgages) are about to become increasingly expensive to compensate for the prolificacy of the banks. As these prices fall, this will cause the entire housing market to seize as people are caught up in negative equity (i.e. paying monthly mortgage repayments on houses that have since been resold for a lesser value).
Crucial to the outcome of this financial crisis will be the impact on inflation and jobs. As people's disposable income falls because of higher mortgage repayments, and government spending decreases because it has to start paying the PFI debts with decreasing tax receipts from a slowing economy, there is likely to be a rise in inflation and unemployment that could lead to a government balance sheet not dissimilar to that in 1976 which saw the IMF walk into Downing Street demanding swinging public service cuts and the UK's very own version of ‘structural adjustment’ more often associated with 1980s African states.
In these circumstances it will be the working classes that will suffer most. Inflation will see the cost of living rise whilst wages will be kept low by rising unemployment. However the rich, as they have done for the last 10 years, will continue to get richer as the misery deepens. George Soros, the financier who single-handedly brought down the Bank of England on Black Wednesday in 1987, has said, ‘I wait until financial chaos ensues, that is when there is money to be made.’
Is society really under threat of collapse?
Those that may doubt the fallibility of the current civilisation might do well to consider the collapses of those gone before us despite the best efforts at the time to resolve the problem. This includes the Roman Empire, the Greek, Egyptian, Maya, Inca and Easter Island civilisations. [15, 16] Jared Diamond describes five main causes of collapses through history:
- Non-anthropogenic climate change
- Hostile neighbours
- Loss of friendly neighbours
- Environmental destruction
- Adherence to outdated or ill-suited values.
Reflecting on these today we seem to have created a new cause (anthropogenic climate change) to add to the list. It is also possible to interpret oil scarcity as environmental destruction (Diamond discusses the unsustainable use of wood when describing the collapses of several previous civilizations) and the adherence to ever-increasing consumption as the ill-suited value. Today’s society should therefore be wary about its apparent immortality.
So where is society on the Handy curves?
There are therefore at least two views of where society currently sits on the progress curve:
- To the left of point A
Those who argue that society lies to the left of point A either believe that there are no realistic threats to continued progress that cannot be overcome by technological development or adaptation or instead cannot conceive that society is fallible to such threats. This is the view of most individuals and groups who are currently in a position of power and is probably the dominant view of most Western populations.
- At or to the right of point A
There is now a significant minority of groups and individuals who contend that society lies close to the peak of progress. This faltering of progress is described as being due to the threats of climate change, rising energy prices (due to fossil fuel scarcity), increasing inequality, disempowerment, diminishing well-being, the rise of the diseases of overconsumption (such as obesity and alcohol-related harm) or rising individualism. Some also caution that the total effect of today’s activities are not seen before a time-lag which might cause an overestimation of the current degree of progress (e.g. the time delay in carbon dioxide emissions causing climate change).
Ultimately the view taken regarding the position on the curve is dependent on the criteria included in a definition of progress, and the weightings given to that progress. Table 1 demonstrates which factors in society can be considered to be getting better, which factors are neither improving nor deteriorating, and which are getting worse. Clearly different audiences will have a range of ideas about which factors should be included in such an assessment.
|
Improving* |
Stable |
Deteriorating |
|
Life expectancy and overall health |
Population well-being |
Climate change and its determinants |
|
Technological development |
Reserves of finite resources such as fossil fuel energy |
|
|
Economic growth and associated availability of goods and services |
Ecological footprint |
|
|
Obesity, alcohol-related harm, drugs-related harm, sexually transmitted diseases |
||
|
Inequalities |
Table 1. Indicators of where society is on the progress curve
* It is recognised that some poor countries and some poor areas within rich countries may not demonstrate these improvements despite an improvement in the mean position.
It is argued here that society is under most threat from its overshoot with regards to anthropogenic climate change, fossil fuel use and the unsustainable economy, and that this places society in a position where a radical alternative future has to be found that is both progressive and is able to prevent or survive these phenomena. Whether or not it is thought that society is nearer point A or point B on Handy’s curve does little to reassure that society is on the correct course. Unless evidence is found to suggest that society is only at the initial ‘take-off’ period of development it is time to find a new and sustainable progress curve that avoids the pitfalls of rising energy costs, climate change and economic collapse.
Acknowledgements and interests
This paper has drawn from the discussions of the Airth group although responsibility for its content lies with the authors. Gerry McCartney is a member of the Scottish Socialist Party.
References
1. Handy C. The Empty Raincoat. London: Hutchison; 1994.
2. Elliott L. Is this the big one? The Guardian 2008; 3 January.
3. Monbiot G. Heat: how we can stop the planet burning. London: Penguin, 2007.
4. King D, Walker G. The hot topic: how to tackle global warming and still keep the lights on. London: Bloomsbury, 2008.
5. Stern N. The economics of climate change: the Stern review. Cambridge: Cambridge University Press, 2007.
6. Lynas M. Six degrees: our future on a hotter planet. London: HarperPerennial, 2008.
7. Campbell C. Oil crisis. Brentwood: Multi-Science, 2005.
8. Dukes J. Burning buried sunshine: human consumption of ancient solar energy. Climatic Change 2003; 61: 31-44.
9. Monbiot G. Worse than fossil fuel. www.monbiot.com, 2005.
10. Richards P. The end of oil: the decline of the petroleum economy and the rise of a new energy order. London: Bloomsbury, 2005.
11. John C. Price elasticity of demand for crude oil: estimates for 23 countries. OPEC Review 2003; 27: 1-8.
12. Strahan D. The last oil shock: a survival guide to the imminent extinction of petroleum man. London: John Murray, 2007.
13. BP statistical review of world energy 2008. London: BP, 2008.
14. Elliott L, Atkinson D. Fantasy island: waking up to the incredible economic, political and social illusions of the Blair legacy. London: Constable, 2007.
15. Diamond J. Collapse: how societies choose to fail or survive. London: Penguin, 2006.
16. Homer-Dixon T. The upside of down: catastrophe, creativity and the renewal of civilisation. London: Souvenir Press, 2007.
Text © Gerry McCartney and Phil Hanlon (2008) and licensed under the Creative Commons Attribution-NonCommercial-ShareAlike 2.5 Licence.
www.healthyfuture.org.uk